Your goal is to create a classifier that transcripts numbers of houses from pictures. You have 30,000,000 annotated images, and billions of images to tag by your system, with automatically detected numbers’ areas.
The test set is prepared to imitate production i.e. images are automatically detected by another classifier.
Can you create the transcription system that will allow hundreds of millions of addresses to be transcribed both faster and at a lower cost than would have been possible via human effort?
Choosing the metric is often the first necessary step for building your ML system because:
What seems to be a general principle for choosing the metric?
What quality of the system do you expect?
For the Street View task, the goal of the project was to reach human-level transcription accuracy. How would you define human-level performance?
The human level performance was estimated to be 98% on the test set. It’s time for creating the first model.
Your colleague says that it’s nice to try a brand new fancy Recurrent Boomerang Network that he found in the paper yesterday. It’s 30% better than previous SOTA in a similar task.
After having a first model, you are thinking of changing the hyperparameters. There are some sensible guesses that learning could happen faster. For now, you are using SGD and batch size equal to 1024. You can extend your batch size and lower the learning rate. What is the best decision that will speed up learning?
After trying a few models, the score is still below the expectations. The guess in the team is that the network can overfit the data. Train and test losses were printed:

A lot of efforts were made to increase the capacity of the model: the network is bigger, deeper, and there’s less regularization. After a bunch of experiments, the score is still below the expectations. Train and test losses were printed:

You decided to visualize the behavior of the model. Which from below is the best to visualize?
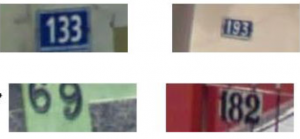
Error analysis proved mistakes to mostly consist of examples where the input image had been cropped too tightly, with some of the digits of the address being removed by the cropping operation. For example, a photo of an address “169” might be cropped too tightly, with only the “69” remaining visible. After visualizing most confident mistakes it became clear that the errors come from. What next?
Image: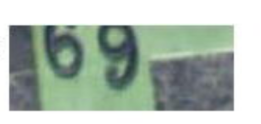
Reference: 169
The simple previous decision added ten percentage points to the transcription system accuracy. Moreover, data seems to be a lot more reasonable to work on. Is there any space for improvement? Let’s plot the loss again:

Should you:
It is necessary to enlarge the model. However, the computational cost was already so high that the management asks not can exceed the conditions they gave. Taking it into the consideration, it’s best:
Congratulations! Your goal has been scored! Take a look at the summary from Deep Learning Book:
Overall, the transcription project was a great success and allowed hundreds of millions of addresses to be transcribed both faster and at a lower cost than would have been possible via human effort. We hope that the design principles described in this chapter will lead to many other similar successes.
Did you like the story? Leave your opinion!